Customize Consent Preferences

We use cookies to help you navigate efficiently and perform certain functions. You will find detailed information about all cookies under each consent category below.

The cookies that are categorized as "Necessary" are stored on your browser as they are essential for enabling the basic functionalities of the site. ... 

Always Active

Necessary cookies are required to enable the basic features of this site, such as providing secure log-in or adjusting your consent preferences. These cookies do not store any personally identifiable data.

No cookies to display.

Functional cookies help perform certain functionalities like sharing the content of the website on social media platforms, collecting feedback, and other third-party features.

No cookies to display.

Analytical cookies are used to understand how visitors interact with the website. These cookies help provide information on metrics such as the number of visitors, bounce rate, traffic source, etc.

No cookies to display.

Performance cookies are used to understand and analyze the key performance indexes of the website which helps in delivering a better user experience for the visitors.

No cookies to display.

Advertisement cookies are used to provide visitors with customized advertisements based on the pages you visited previously and to analyze the effectiveness of the ad campaigns.

No cookies to display.

Earth Systems Unit, Moncton – 2nd grade

Mar 1, 2018

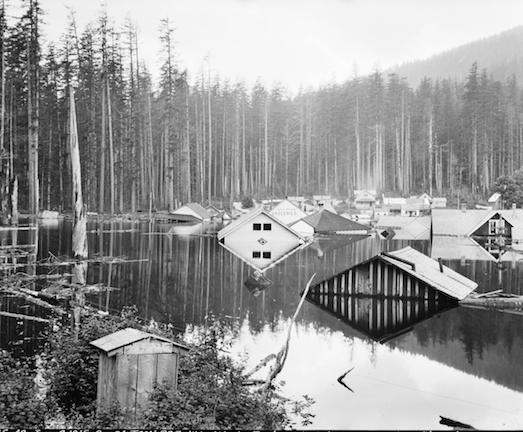
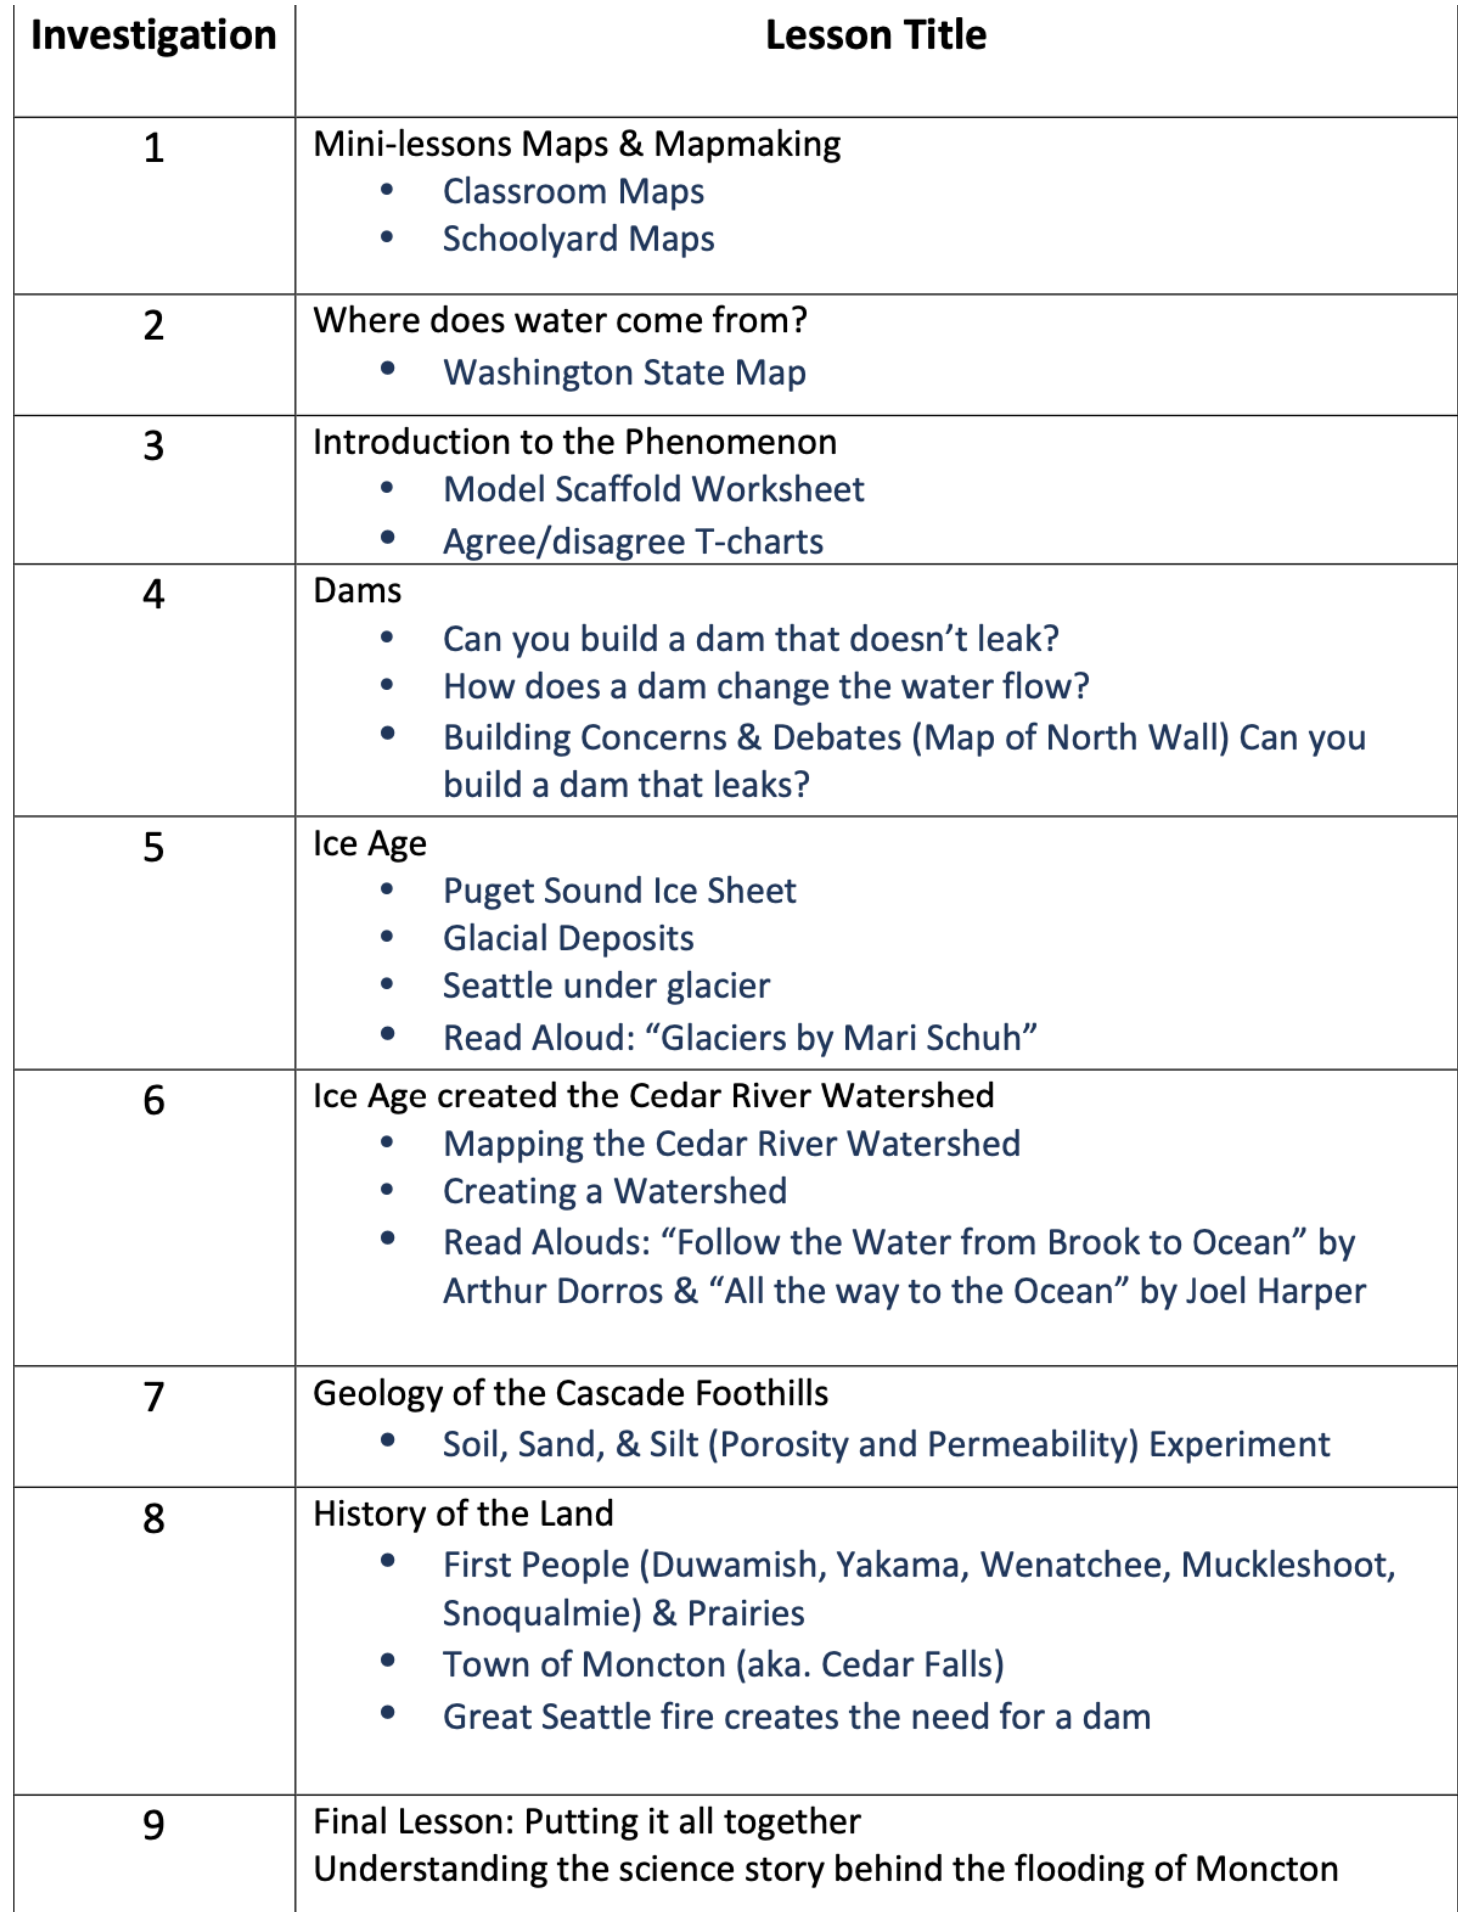
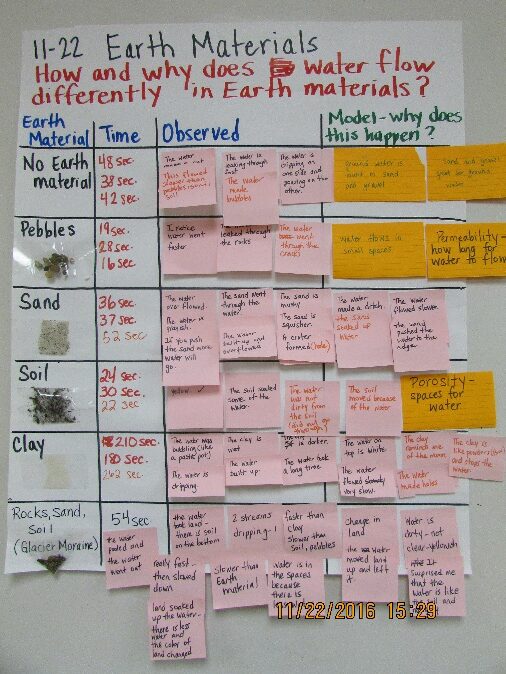
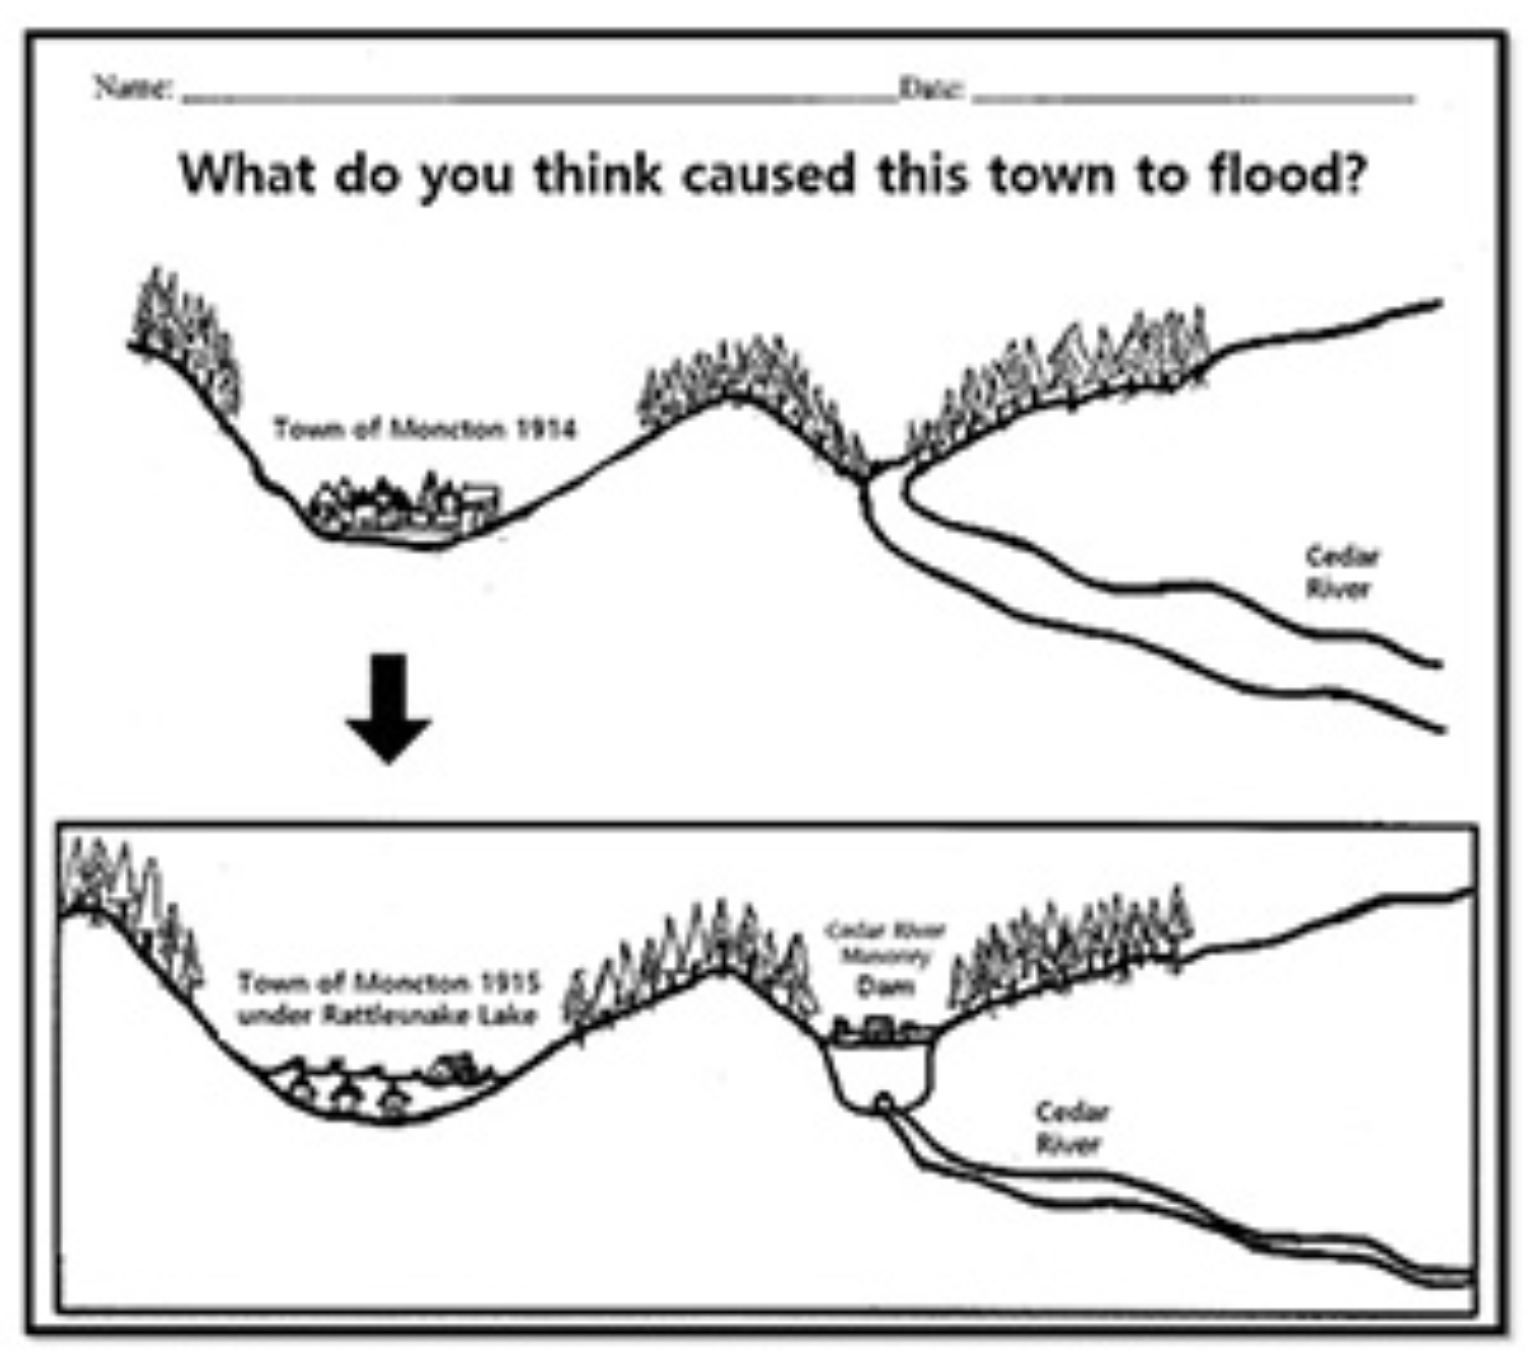
In this 2nd grade unit, students construct their explanations about a puzzling and historical phenomenon: Why did a town next to a mountain (the town of “Moncton”) flood after a dam was built on the opposite side of the mountain? Throughout the unit, students engage in a number of activities (readings, investigations, and watching videos) to gather evidence and revise their models and explanations about how and why the town flooded. Students can learn about how dams affect water flow and landscapes, ice age and glacial moraines, how the structure and properties of different earth materials can affect water flow, and how water can change the shapes and kinds of land quickly or slowly. Written by Michelle Salgado, Jennifer Richards, Soo-Yean Shim, and Kitten Vaa in collaboration with the University of Washington’s Ambitious Science Teaching group and Highline Public Schools, with funding from the University of Washington, Highline Public Schools (Sub-award from the Department of Education, Race To The Top grant and the National Science Foundation (DRL 1417757).

See how Kitten Vaa’s second-grade class generated evidence-based arguments for what caused the town of Moncton to flood. This three-video series was created in partnership with the Teaching Channel and supported by funding from the National Science Foundation (DRL 1417757): 

Storyline

Lesson title and investigation number: 1. Mini-lessons Maps & Mapmaking -Classroom Maps -Schoolyard Maps 2. Where does water come from? -Washington State Map 3. Introduction to the phenomenon -Model Scaffold Worksheet -Agree/disagree T-charts 4. Dams -Can you build a dam that doesn't leak? -How does a dam change the water flow? -Building Concerns & Debates (Map of North Wall) Can you build a dam that leaks? 5. Ice Age -Puget Sound Ice Sheet -Glacial Deposits -Seattle under glacier -Read Aloud: "Glaciers by Mari Schuh" 6. Ice Age created the Cedar River Watershed -Mapping the Cedar River Watershed -Creating a Watershed -Read Alouds: "Follow the Water from Brook to Ocean" by Arthur Dorros & "All the way to the Ocean" by Joel Harper 7. Geology of the Cascade Foothills -Soil, Sand, & Silt (Porosity and Permeability) Experiment 8. History of the Land -First People (Duwamish, Yakama, Wenatchee, Muckleshoot, Snoqualmie) & Prairies -Town of Moncton (aka. Cedar Falls) -Great Seattle fire creates the need for a dam 9. Final Lesson: Putting it all together. Understanding the science story behind the flooding of Moncton

Four young students looking at agree and disagree t charts with the claim at the top of the t charts reading: ; We claim that the water went through the ground to the town.A chart about earth materials. The chart poses the question: How and why does water flow differently in Earth materials? The chart also has columns for earth material (with different materials for each row such as pebbles and sand), time, what was observed, and model - why does this happen?

Equity

Stories

Teacher Educators & Professional Learning

Research and NGSS

Related Posts

This site is primarily funded by the National Science Foundation (NSF) through Award #1907471 and #1315995