 This family of tools was developed to help students to construct and revise evidence-based explanations and models for complex phenomena. Face-to-face tools are used with students to represent and work on their current ideas. Ideas written on face-to-face tools “belong” to students are supposed to change over time as the unit progresses. These tools serve as a record of that change, as well as resources for the students to use as they learn and progress. These representations are often put on the walls of the classroom so that students’ current thinking can be made public and revised over time. So, these tools don’t just display thinking, they help organize and refine student reasoning.
Some types of face-to-face tools are described below. You can also reference this downloadable document.
Small Group Models
 The most versatile way to make students’ thinking visible is the small group model. Students in groups create their own initial models at the beginning of a unit, then revise these over the course of a unit. These could be representations of the anchoring phenomenon that the teacher has introduced on the first day, or the teacher might ask students to draw a model that is about an event or process similar to the anchoring phenomenon that will be the focus of an entire unit.
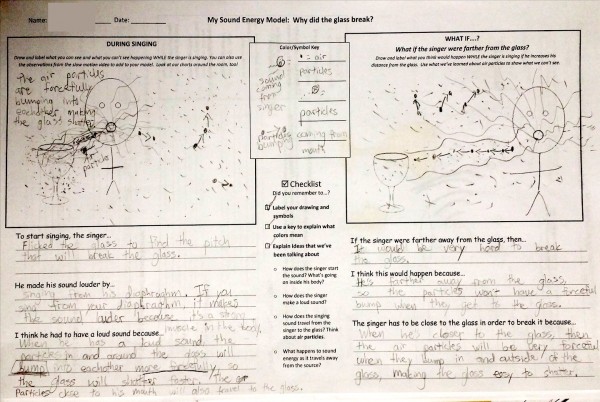
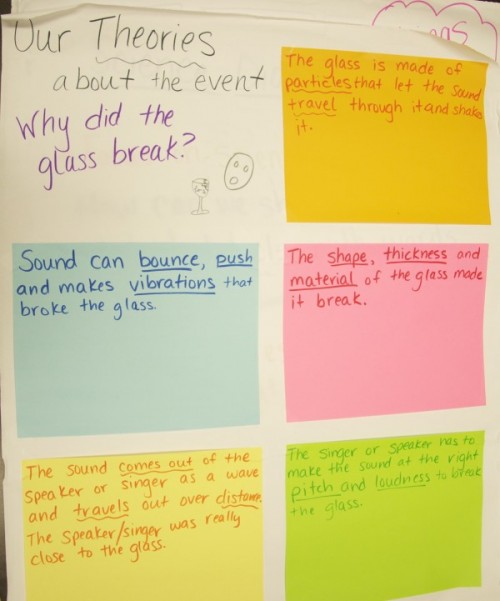
For example, one of our 5th grade classes was studying the physics of sound. The teacher had students draw a model of a singer who was able to break a glass with just his voice (on right, click to see full view). To the right is a “what if” model of the singer standing a few feet away from the glass and trying it again. This model had been revised from an earlier version in which there was no depiction of energy or air particles.
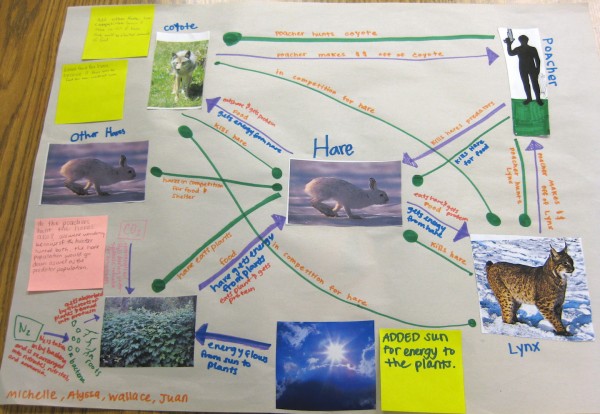
One of our high school biology classes was studying ecosystems and in particular the question of why a population of hares in a northern forest would go up and down in regular cycles every 11 years. The “concept map” diagram you see here (click to see full view) was drawn later in the unit. Its one of the few examples where one of our models does not show the passage of time (before and after, or before, during, after).
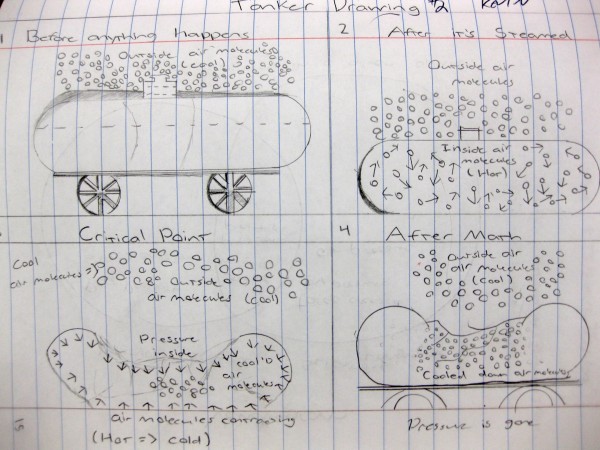 In the third model, this group of 8th grade students were depicting the observable and unobservable events behind the mysterious implosion of a railroad tanker car. It had been steam cleaned and then accidentally sealed shut. This is an excellent example of something we advocate for: the before, during and after drawings of a phenomenon. This is a revised drawing done in the middle of a unit after students had learned about kinetic molecular motion and atmospheric pressure.
3 Strategies for focusing students on the phenomenon and eliciting the most reasoning from them:
- 1. We have learned that the before-during-after drawings are particularly helpful for students to show what they think is happening. It requires students to show much more of their thinking. Many of the most compelling classroom conversations about a phenomenon have been about what happens before it starts, or after it stops. Why does something stop happening? Always interesting.
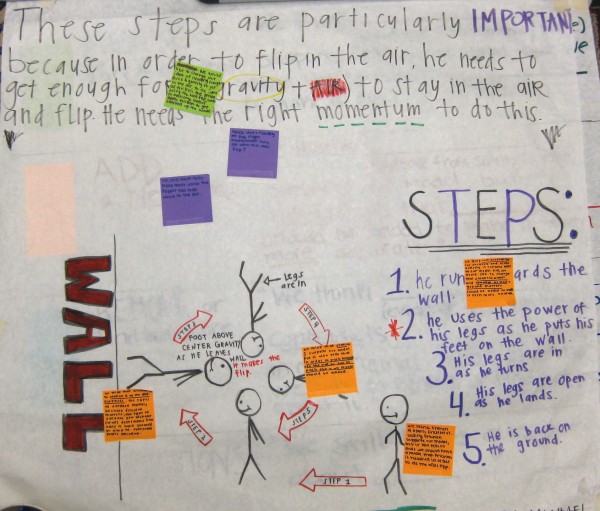
- 2. Our teachers and their students have also come up with other novel ways to show the passage of time during an event. In a high school physics classroom studying force and motion, the teacher had students draw what unobservable events and processes were at work as a young man did a back flip after running up to a wall and pushing off of it (shown to students on a video). They decided to use a single frame to draw the man at five different stages of the run—including him standing still at the beginning.
- 3. We have also found that for micro-level events, it helps if you ask students to “draw what you would see if you had microscope eyes.” It sounds simple, but works well.
We now offer a major caution. Make sure the model is about a particular event or process with some context to it. By context we mean that the event or process happens in a particular time or place or under particular conditions, and that all these special conditions matter to the explanation.
If you ask students to model a generic phenomenon (like the water cycle or how levers work) they will simply reproduce textbook explanations. We refer to this as “posterizing” someone else’s science ideas. Posterizing is not intellectually challenging, all the students in the class would likely have the same models drawn.
Helpful advice from our teacher colleagues who have successfully used small group models:
- Always ask students to draw both observable and unobservable features. The exception here might be the initial models of young elementary students.
- Agreement about drawing conventions is important. After students have drawn an initial model, have a conversation with them about how the class should represent certain ideas, so that everyone understands each other’s drawings (i.e. What do we all agree that arrows will mean? How will we agree to draw molecules? How will we show that time is passing?).
- As an equity move, have each student within a group use a different color marker or tell students you want to see everyone’s handwriting somewhere on the model.
- For drawings that may be hard to sketch out, provide a template with outlines for students to use as a guide. When we ask student, for example, to draw what they think is happening during homeostasis (such as regulating body heat in humans), we provide an outline showing a human body before, during and after a heat stroke—that’s all they need to get started. Their drawings are then a bit more comprehensible to the teacher and to peers in other groups.
- Have students change the model substantively only once in the middle of the unit, then at the end.
- To make comparisons between models more manageable for students (since there may be several in one classroom) and to promote equal participation, have each student in a group visit other groups’ models to look for how one particular relationship in the model differs across these drawings.
Whole Group Consensus Models
 When students are less experienced with how to draw and change models, the teacher can start a unit by focusing everyone on a single drawing or set of drawings that the class as a whole “owns.”
A whole class consensus model can be started immediately after students have had some introductory experience with a puzzling phenomenon. On a piece of poster paper, or the whiteboard, the teacher can draw a very basic pictorial representation of the phenomenon that students are exploring. Then, with input from students, the teacher can add labels on this drawing that indicate students’ hypotheses about underlying events or processes that influence the phenomenon. These are the students’ initial hypotheses in diagrammatic form. The teacher coordinates drawing this initial consensus model, with help and input from students. As the students engage in upcoming rounds of activity and discussions, they should decide how they want to change the consensus model.
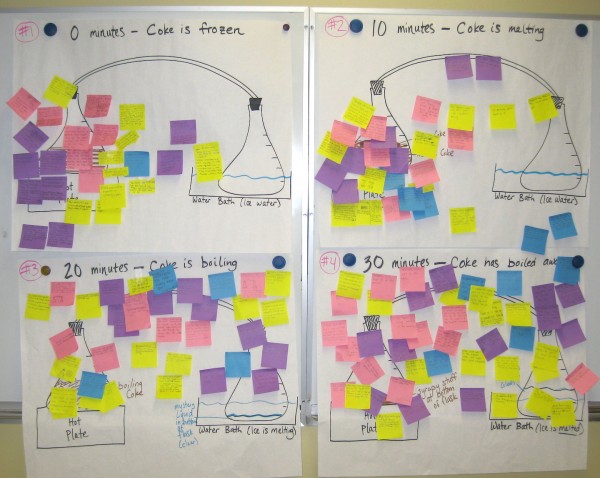
One example here is a 4-part time-lapse model of the distillation of a soft drink. The students had written on sticky notes what they thought was happening at each stage, and at each place on the distillation apparatus. Note there are some places where students are not venturing an idea about what is happening that they cannot see.
At first, these drawings should be really spare (simple, not cluttered). Students may have only idea “fragments” to contribute that are not necessarily contradictory to the scientific explanation, only very simple. These are ideal for noting on the consensus model, because they can be built upon and changed later as students learn more. Also, the teacher should use student language in the initial model rather than imposing scientific language at this point. It’s their model.
Helpful advice from our teacher colleagues who have successfully used whole class consensus models:
- All of the recommendations from the “small group models” section also apply the whole class consensus models.
- If there are clear misconceptions that students initially think should be part of this model, then you’ll have to think of a way to label these as “still in doubt”— you can, for example, label them (or all the ideas) with large question marks to indicate the tentative nature of these ideas.
- Next to the drawing, or below it, there should be space for “Questions we still have about…” This will tell you a lot about what parts of the phenomenon they are interested in. You should capitalize on these questions in your instruction and use their questions to identify where their gaps currently are.
- Use small group models more regularly than whole class models. The small group models reveal more student thinking, generate a sense of ownership, and require more intellectual work.
Summary Tables
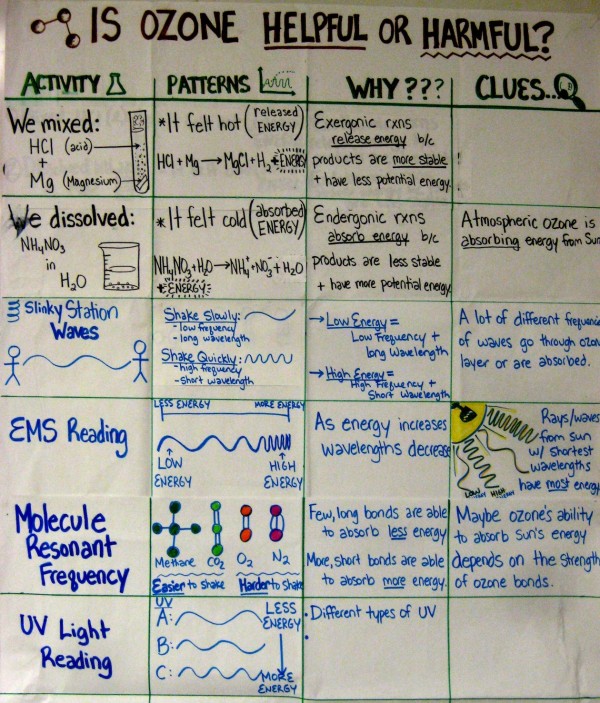
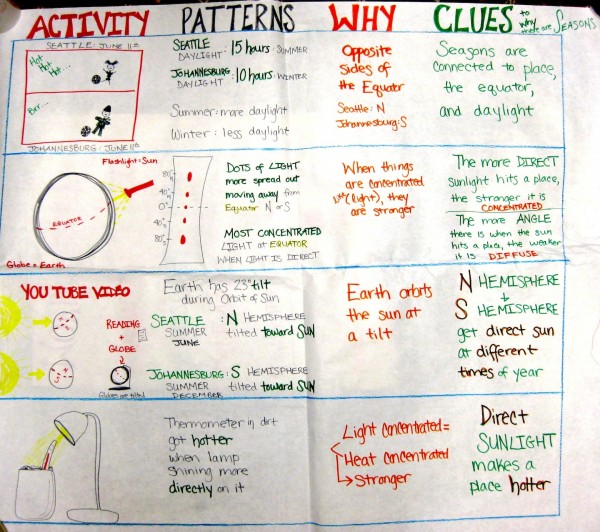 The summary table is one of the most indispensable tools in ambitious science teaching. The first shown here is for a middle school unit about “Why are there no seasons if you live near the equator?”, the second is from a high school physical science class on whether ozone is helpful or harmful (we note that this is a good question, but not a phenomenon). Because a model is supposed to change over time, and in response to new evidence or arguments, students need to have some record of what they have done over the past few days, in order to draw upon different activities or readings. Without some representation of what they have done or read, they would have to depend on memory, and each student’s memory is different. So, just as scientists do, the teacher can help students keep a record of activities and ideas.
We have found that the best way to keep a record of activity and ideas is to create a table with four columns—1) Activities we did, 2) Patterns or observations, what happened?, 3) What do you think caused these patterns or observations?, 4) How do these patterns help us think about the essential question or puzzling phenomenon? As you can see in the figures included here, there are many variations created by our teachers. They are all adaptations that are useful for their particular classroom needs.
 The table is placed on a wall in the classroom and it remains up throughout the unit. After each round of reading and activity, students are in charge of discussing how the activity helps them think about the phenomenon, and filling in one complete row. As the unit progresses, more and more rows get filled in and, ideally, students start to piece together a more coherent and complete explanation by looking “down” the fourth column.
Some teachers argue that they don’t have enough wall space to keep summary tables for every class period, however there are always ways around this by using a flip chart or simply making space on your walls.
Helpful advice from our teacher colleagues who have successfully used Summary Tables:
- Don’t put too many columns into your summary table, and don’t have more than five rows.
- The students should be in charge of negotiating what goes in each column after a reading or activity. At the elementary level the teacher would take more responsibility for crafting the sentences.
- Don’t wait until the end of a unit to fill in the rows (we’ve seen this happen), it is unhelpful and confusing for students. Fill in each row after each activity.
Sticky Notes
 Models are meant to be changed. Models can have ideas added to them or ideas deleted from them. They can have relationships changed. The ideas embedded in them can be questioned by students. Students learn from both suggesting changes and receiving suggestions for change.
We have found that “sticky-notes” are the best way for the whole class to experience how ideas can shift with new information, evidence, or logical argument. These are small, color-coded notes that are applied by students directly to the models. The color represents the type of comment one wants to make about some aspect of the model. The comment is written on the note, rather than on the model itself. Our teachers learned to use the notes, in part because re-writing on the model itself got sloppy, and the owners of the models felt that their ideas were being “over-written.”
We have also found that with some scaffolding, students become quite capable of offering productive forms of commentary. This is partially because the color codes guide and constrain the types of comments. There are no color codes, for example, for commenting on how artistic the drawing is or how legible the handwriting is. Instead, we generally group comments under three categories: “Adding an idea,” “Revising an idea,” or “Posing a question.” In the model of a man doing a back-flip (for high school physics), the orange sticky note on the lower left is adding on an idea that came from an activity the students had just done: We think according to Station 4 with the different surfaces, the type of surface matters because friction matters. The type of surface you kick off of (wall) determines how hard or easy it is to overcome static friction. This caused the group that received the comment to make changes in their model to make it more accurate and to reflect more of what they had learned about friction.
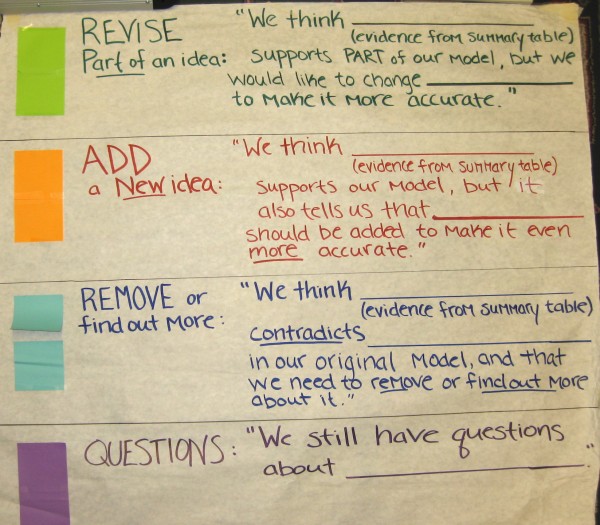 Students are not familiar with talking (or writing) this way. We use sentence frames as a way to guide their writing. We have seen that students not only use these sentence frames, but after a few weeks, they begin to take up the “grammar” of science talk in their own speech with peers and with the teacher.
Helpful advice from our teacher colleagues who have successfully used sticky notes
- Because students are reluctant to comment on the drawings of others, we have had them “practice” by placing notes on their own models after a couple of lessons. They learn how to look at their own models, and how to write notes in full sentences that provide reasons for requesting possible changes.
- We always provide sentence frames for them to use. It helps them use scientific ways of talking/writing to express the rationale for possible changes. It also keeps comments from being trivial. We have yet to find the “perfect” sentence frames!
- One of the sentence frames should be about a puzzle or a question that a group has, this opens the door to really new ideas or to identify gaps in the potential explanation that could not be expressed in any other way.
- Don’t have too many comments on each model, only one or two groups should really comment on another group’s particular model.
- Spend time, after the commentary, for the owners of the model to read the notes and decide if they should act upon the suggestions.
Competing Hypotheses
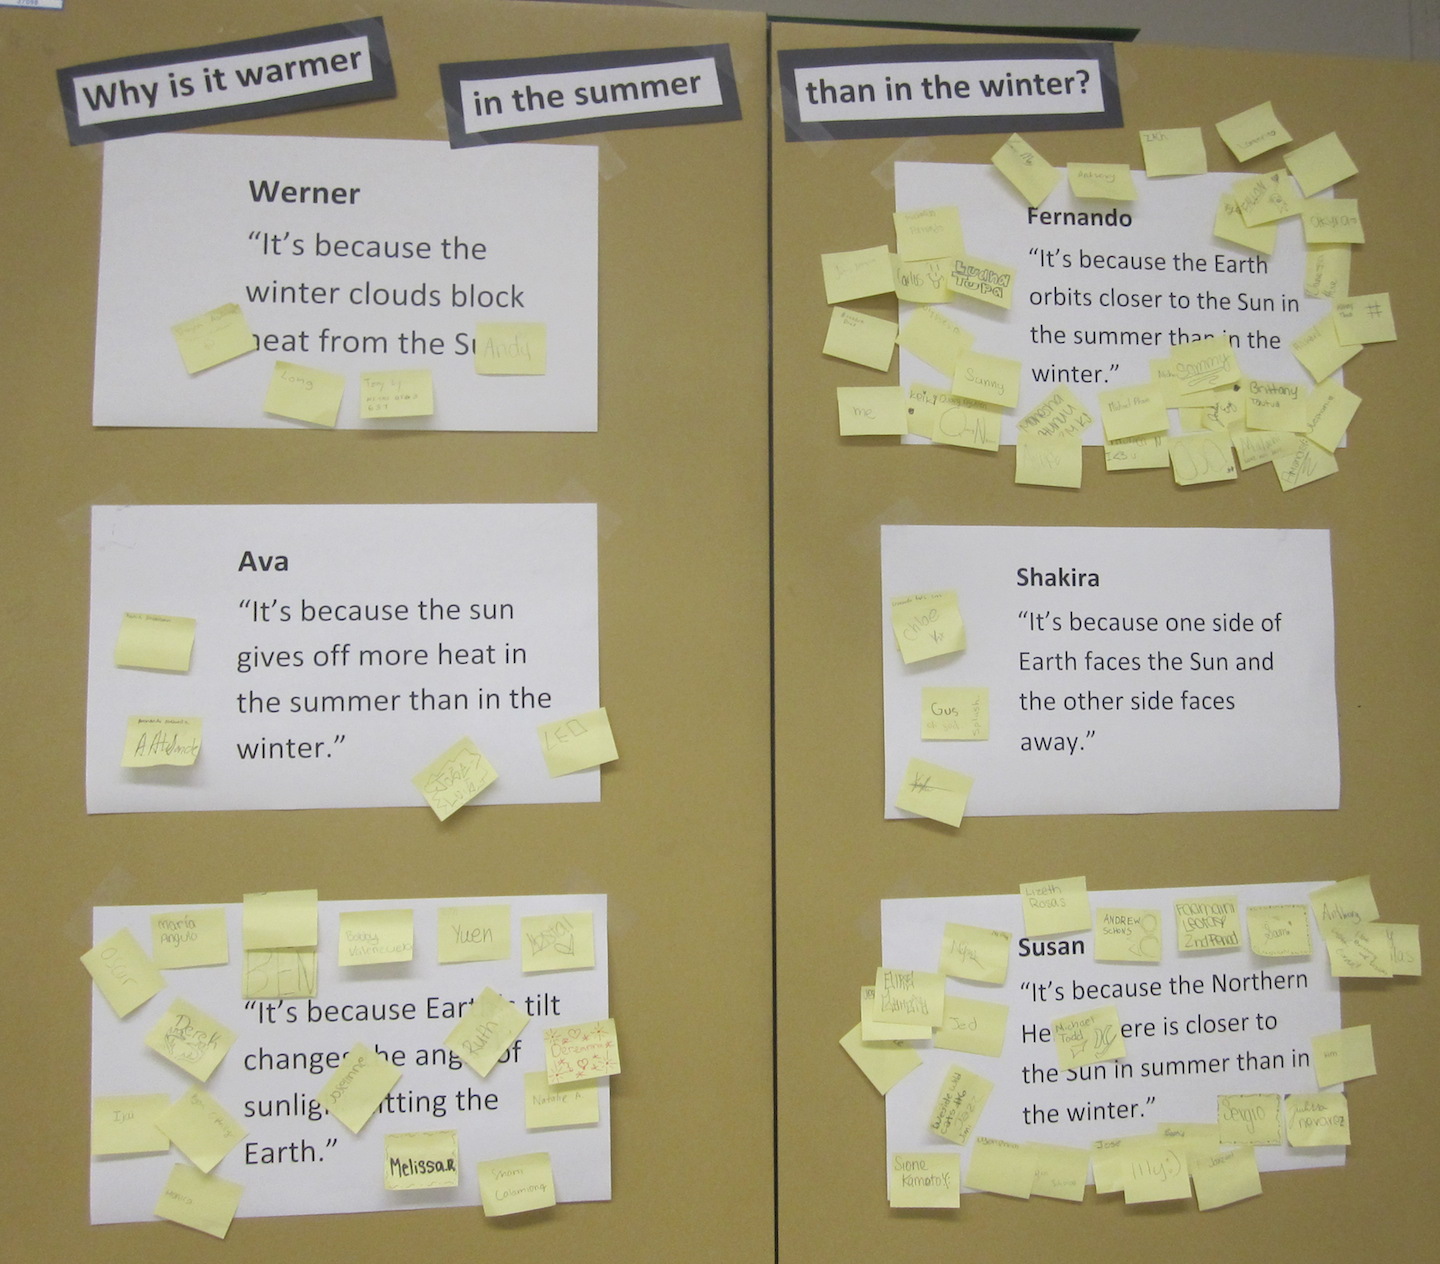 If you want to try a more manageable version of whole class models, you can do “testing a list of hypotheses.” These hypotheses are not full explanatory models, but they would get you and your students on the path to representing tentative ideas, then testing those ideas and changing them over time. The illustration we use here is what causes the seasons?
You can list potential hypotheses that students initially have about “what’s going on” in an anchoring event. These answer the question, “What might be contributing to or causing X?” These hypotheses can be very simple to start with. They are usually a mix of one-sentence observations, inferences, and mini-theories, but they are not full blown explanations. Don’t deny students’ contributions because they are brief or because they aren’t using scientific language.
Generating this list might be followed by probing for more pieces of the causal story. Place a question mark behind each hypotheses at first so students understand that the hypotheses are not yet supported by evidence. As you then engage in cycles of reading, activity, and connecting with everyday experiences, you can gather evidence and ideas that can be applied to the list of hypotheses. Some hypotheses might get crossed out as implausible, others might be supported, others might be elaborated upon as time goes on, and some hypotheses might be linked with others.
 After a couple of activities and readings, you may be ready to ask students to start a public conversation about how the evidence they’ve generated can support or contradict a hypothesis. One way to do this is to place on the board (or a piece of poster paper) two competing explanations for the anchoring phenomenon or puzzling question that you’ve based your unit on. Ideally, one of these hypotheses can be a partial explanation that some of your students had originally favored, but is not complete or lacks scientific cohesion. The other explanation should be scientifically coherent, and ideally also generated by your students. Under each explanation is a list of the activities or readings the students have done recently.
Then, in small groups, students are given a prompt from a lab activity or reading they have done. On this prompt can be some statement about what the key ideas were that students have learned from the activity or reading—this could have been generated by the students themselves when they did the activity. All the small groups can then spend 5 or 10 minutes deciding if what they had learned from that activity or reading supports one or both of the explanations, or if it contradicts one or both of the explanations. If it supports an explanation, they can write on a yellow sticky note why it supports a particular explanation. If it contradicts or does not support an explanation they can use a blue sticky and explain why. At the end of this round a student from each group comes up to the board and in the box that represents that particular activity or reading (below one of the explanations) they can place their sticky note. This could be done for example on this list of hypotheses used by a 3rd grade group of students studying sound—How could a singer break a glass with just the energy from his voice?
The teacher then reviews the sticky notes with students and moves on to the next type of evidence. There may be 1 or 2 rounds of this activity during a class period. This can be repeated two or three times during a unit, and the sticky note table can remain up in the room in the interim.
Caution! This activity does not, by itself, help students come up with a rich causal explanation; you should couple this activity with going back to some whole group model or small group models, and have students periodically re-write or re-draw their causal explanations.
Explanation Checklist
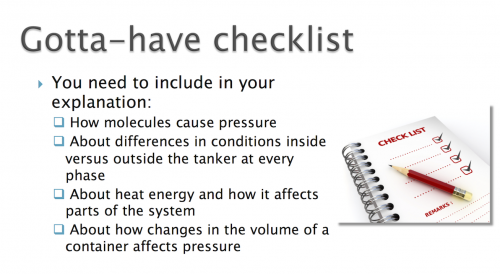
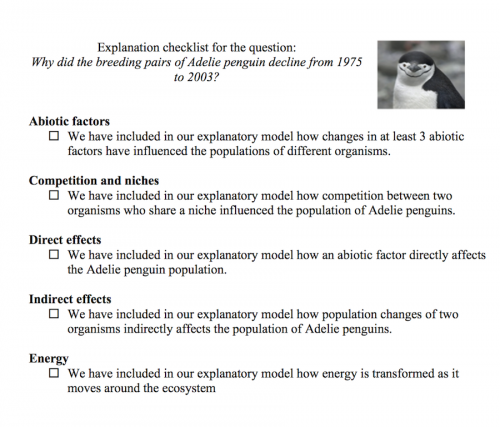 The “gotta-have” checklist is a set of ideas or concepts they think must be included in the final explanation. This is more constructed by students than by the teacher. This may start with very simple statements or even just terms, but the list should grow over time— added to by students with occasional prompting by the teacher. Again, as the students engage in cycles of reading, activity, and connecting with their everyday experiences, they add to this checklist. If they are missing some key elements of the final causal explanation, it should alert you as the teacher to modify your instruction to address these missing pieces.The first example is a list developed by high school students on the explanation for why a population of penguins had declined over time in the Antarctic. The “Gotta-have” explanation checklist is not a list of vocabulary words that have to be included in drawn or written explanation. As the checklist is developed, lesson by lesson, it needs to be composed of ideas, or relationships that the students now believe are important to a final explanation. These items on the checklist are not “giving away answers.” They remind students of what is important to talk about or draw out, and these are ideas that they have come up with themselves during the unit. The second example is a “gotta-have” checklist that was developed by students during a unit on the Gas Laws. The anchoring phenomenon for the unit was a railroad tanker car that had imploded after being steam cleaned, then mistakenly sealed up.
Helpful advice from our teacher colleagues who have successfully used “Gotta-have” checklists:
- An explanation checklist can be started at the beginning of the unit, but should be added to or subtracted from every few days as the students learn more.
- Students should co-develop the list with you—it is a representation of their thinking, not yours.
- Keep away from making it a vocabulary checklist. Including the word “how” (see Gas Laws checklist above”) sometimes helps you as a teacher express the items as ideas, rather than as words.
- When students are creating their final explanatory models, make sure they have access to the checklist—it works very well as a common set of ideas that the teacher can refer to as he/she circulates around the room and supports the construction of the final models.


 This site is primarily funded by the National Science Foundation (NSF) through Award #1907471 and #1315995